














Battery Voltage Chart: How to Check Battery Health
Whether you’re maintaining a vehicle battery, storing solar energy, or preparing for a power outage, understanding battery voltage is one of the easiest ways to monitor battery condition. A battery voltage chart helps you estimate a battery’s state of charge (SOC) by comparing its resting voltage with standard reference values. Because different battery chemistries have different voltage characteristics, using the correct chart is essential for accurate readings. This guide explains how to interpret battery voltage charts, compare common battery types, and apply voltage readings in real-world situations.

What Is a Battery Voltage Chart?
A battery voltage chart is a reference table that matches a battery’s resting voltage with its approximate state of charge (SOC). By measuring voltage with a digital multimeter and comparing it with the correct chart, you can quickly estimate how much charge remains.
Different battery chemistries require different charts because they discharge differently. Lead-acid batteries show a gradual voltage drop as they lose charge, making voltage a reliable indicator of SOC. In contrast, lithium batteries maintain a relatively stable voltage through most of their discharge cycle before dropping rapidly near empty. This means a lithium battery voltage chart provides only a general estimate unless combined with a battery management system (BMS).
For the most accurate results, measure battery voltage after the battery has rested without charging or discharging for at least 30 minutes.
Battery Voltage Chart by Battery Type
Not all batteries behave the same way. Choosing the correct voltage chart for your battery chemistry is essential for interpreting readings accurately.
12V Lead‑Acid Battery Voltage Chart
Flooded lead-acid batteries are widely used in vehicles, backup power systems, and some off-grid applications. Their voltage decreases steadily as the battery discharges.
| Resting Voltage | Approximate SOC | Battery Condition |
|---|---|---|
| 12.70V | 100% | Fully charged |
| 12.50V | 90% | Excellent |
| 12.30V | 70% | Good |
| 12.10V | 50% | Recharge recommended |
| 11.90V | 30% | Low charge |
| 11.50V | 0% | Fully discharged |
To maximize battery life, avoid repeatedly discharging a lead-acid battery below about 50% SOC.
12V AGM Battery Voltage Chart
AGM (Absorbent Glass Mat) batteries are sealed lead-acid batteries with similar voltage behavior but better performance and less maintenance.
| Resting Voltage | Approximate SOC | Battery Condition |
|---|---|---|
| 12.80V | 100% | Fully charged |
| 12.60V | 90% | Excellent |
| 12.40V | 70% | Good |
| 12.20V | 50% | Recharge soon |
| 12.00V | 30% | Low charge |
| 10.50V | 0% | Fully discharged |
12V LiFePO₄ Battery Voltage Chart
LiFePO₄ batteries have a very flat discharge voltage curve, so voltage alone is less precise for estimating SOC.
| Resting Voltage | Approximate SOC |
|---|---|
| 13.60V | 100% |
| 13.40V | 90% |
| 13.30V | 80% |
| 13.20V | 70% |
| 13.00V | 50% |
| 12.90V | 20% |
| 10.00V | 0% (BMS cutoff) |
Lithium‑Ion Battery Voltage Chart
Typical for consumer electronics and some portable power systems.
| Resting Voltage | Approximate SOC |
|---|---|
| 12.60V | 100% |
| 12.20V | 80% |
| 11.90V | 60% |
| 11.60V | 40% |
| 11.30V | 20% |
| 10.00V | Nearly Empty |
What Can Battery Voltage Tell You?
- Estimate state of charge (more reliable for lead-acid, less for LiFePO₄)
- Identify deeply discharged batteries that need immediate charging
- Detect weak or aging batteries that don’t hold voltage properly
- Help avoid damage from over‑discharging
Voltage readings are affected by temperature, recent charging, and electrical loads. Always use resting voltage for the most meaningful results.
How to Use a Battery Voltage Chart in Real Life
Checking a Vehicle Battery
Measure resting voltage before trips. Low or slow‑recovering voltage may mean a weak battery.
Monitoring RV / Marine Deep‑Cycle Batteries
Use the lead-acid or AGM chart to avoid draining below 50% capacity, which extends life.
Managing Solar & Backup Power Systems
LiFePO₄ batteries rely more on BMS readings than voltage charts, but periodic checks still help spot anomalies.
Maintaining Portable Power Stations
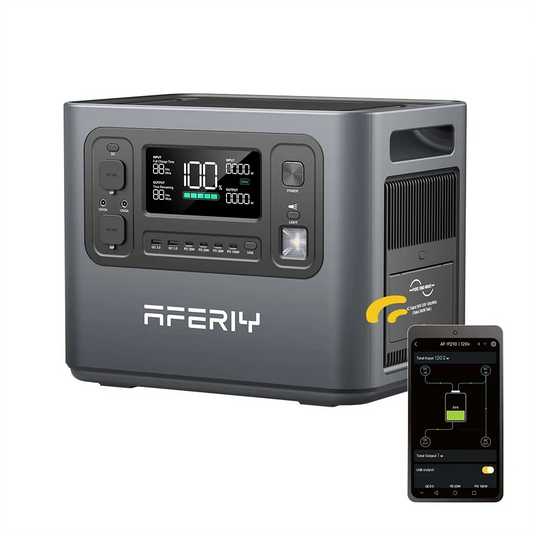
Modern units like the AFERIY P180 Pro show real‑time SOC on a display or app, removing guesswork from voltage charts.
Choosing a Battery Backup Solution Based on Voltage
Understanding a battery voltage chart helps you estimate a battery’s state of charge, but voltage alone doesn’t provide the complete picture. Modern portable power stations use intelligent Battery Management Systems (BMS) to monitor voltage, current, temperature, and charging status in real time, giving users a more accurate view of battery health than a LiFePO4 battery voltage chart or lithium battery voltage chart alone. This makes battery management simpler, especially for home backup and off-grid applications.
A good example is the AFERIY P180 Pro Portable Power Station, which combines a 1024Wh LiFePO₄ battery with a 1800W pure sine wave inverter for stable power delivery to household appliances and sensitive electronics. It features a built-in LCD display and app monitoring, allowing users to check battery percentage, power input and output, and remaining runtime without relying solely on voltage readings. With 4 charging options (AC, solar, car, and AC + solar), less than 10 ms UPS switchover, and expandable capacity up to 5120Wh, it can adapt to everything from camping trips to emergency home backup.

When choosing a battery backup solution, battery chemistry is only part of the equation. Features such as a long-life LiFePO₄ battery, intelligent battery monitoring, flexible charging methods, expandable capacity, and reliable safety protection have a much greater impact on everyday usability. A system that combines these capabilities not only simplifies power management but also delivers more dependable performance across a wide range of indoor and outdoor applications.
FAQs
What voltage is too low for a 12V battery?
Below 12.0V resting for lead-acid / AGM indicates deep discharge and risks damage.
Can voltage show remaining charge accurately?
Yes for lead-acid; only roughly for LiFePO₄ due to its flat discharge curve. A BMS is much more accurate.
Why does voltage drop under load?
Internal resistance causes a temporary dip. Voltage recovers after resting.
How often should I check battery voltage?
Vehicles: every few months.
RV, solar, backup batteries: monthly.
Conclusion
A battery voltage chart is a simple, effective tool to judge state of charge and health. Lead-acid batteries correlate closely with voltage, while lithium batteries need a BMS for precision. Always measure resting voltage and use the chart for your battery chemistry to avoid over‑discharging and extend battery life.
For backup power and off-grid use, modern portable power stations provide accurate SOC readouts automatically, making voltage reference charts less necessary for daily use.
 Free shipping from US local warehouse